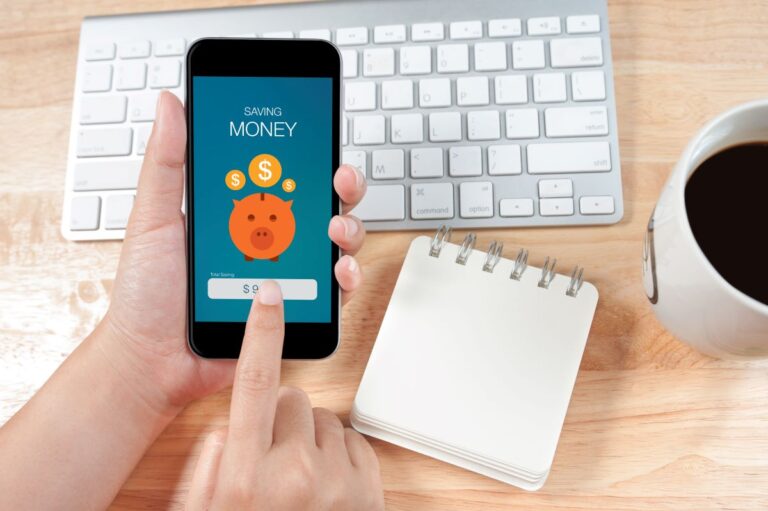
10 Best Money Management Apps for Australians (2024 Update)
Looking for a money management app to help you budget? Here are 10 of the best budget apps for Australians, including new apps available in 2023.
Looking for a money management app to help you budget? Here are 10 of the best budget apps for Australians, including new apps available in 2023.
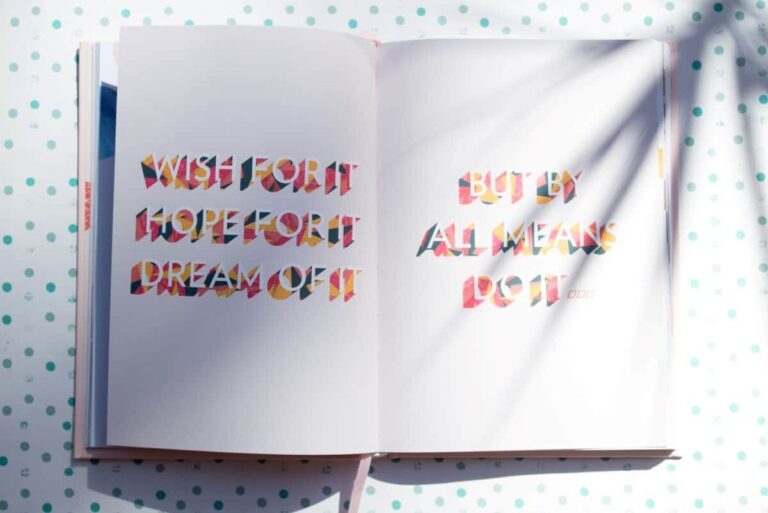
Here’s how I set financial goals, with the strategies I use to help achieve them. Go beyond SMART goals with these 10 money goal strategies.
Are you looking for ways to take control of your money? This book might be the answer. Book Review of Ditch the Debt and Get Rich by Effie Zahos
Tips and tricks to help you save money on school lunches. Looking for ideas to reduce the cost of packing school lunches every day? Packing a school lunch is definitely cheaper than buying from the tuckshop, but all those ‘lunchbox additions’ that supermarkets sell can really add up! Below are eight tips for saving money…
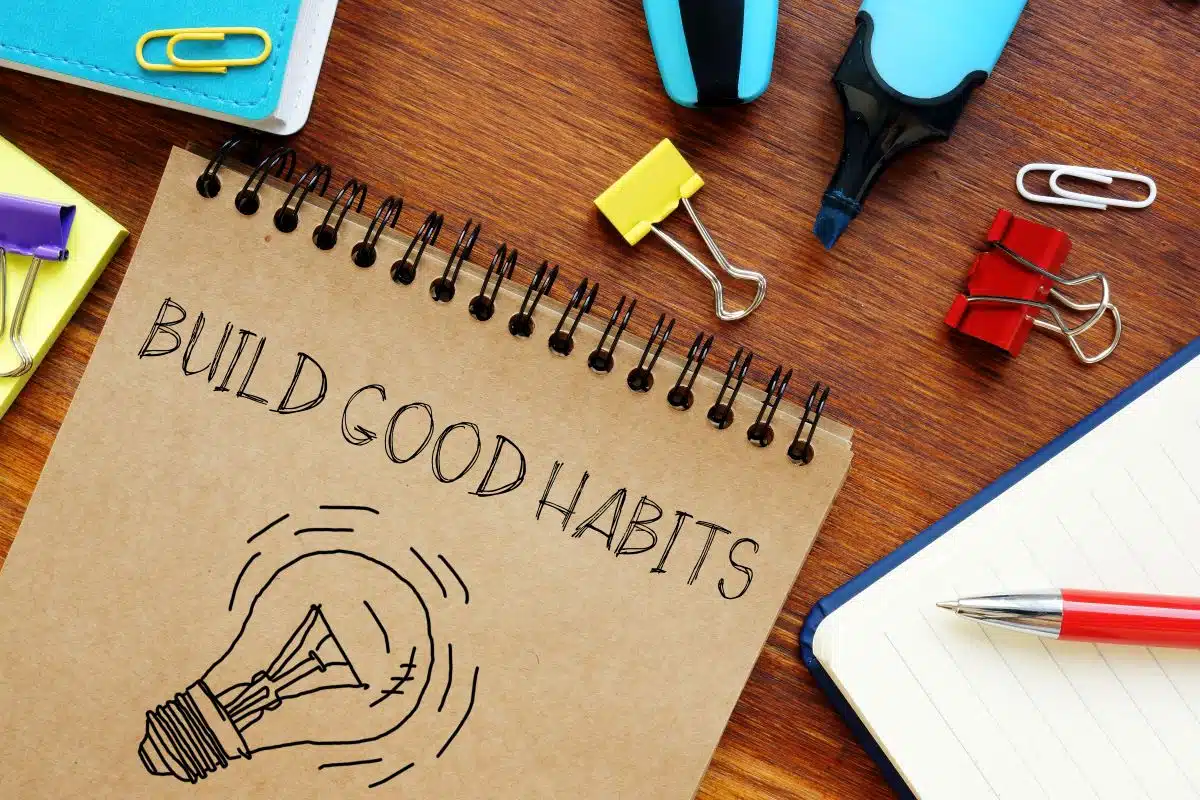
The key to sticking to your budget is to create good money habits. Master these habits, and the savings follow.
Successful budgeters have better budgeting strategies. In this episode, I share I’ve learned to help me stick to my budget.
If you’ve ever wondered if it’s worth your time and energy to save a few cents here and a couple of dollars there, in this article I present the case for small change and show how small savings can add up.